

The Real Problem: You Can’t See What’s Working
Most growing contractors don’t have a “no marketing” problem.
They have a no-clarity problem.
You’ve got money and effort going into your website, your Google Business Profile, Google Ads, Local Service Ads, maybe some SEO and Meta campaigns. You might have an agency, a part-time marketer, or someone in the office trying to keep it all moving.
Some of it works. Some of it doesn’t.
But when leads slow down or jobs get thinner, it’s almost impossible to see:
- What’s actually pulling its weight
- Where leads are leaking
- What to fix first
So decisions get made on gut feel:
- “Turn off those ads, I don’t think they’re doing anything.”
- “SEO’s not working, we’re not getting calls from Google.”
- “We just need more referrals.”
There’s a better way to run the business.
You don’t need 20 different dashboards or a big in-house marketing department. You need a simple scorecard for your marketing—five numbers you can look at every month that tell you:
- Is our marketing system working?
- Where are we leaking leads or profit?
- What should we tune next quarter?
If you’re already investing in a contractor marketing system, website, Google, ads, follow-up—you need a simple way to see if it’s actually working.
This article walks through that Contractor Marketing Scorecard in plain language so you and your team can stop guessing and start making decisions.
Not a Leads Problem—A Visibility and Clarity Problem
For most contractors with a few trucks and crews on the road, the marketing reality looks like this:
- The website was built a few years ago and updated “when we have time.”
- Google Business Profile is claimed, but reviews and photos are inconsistent.
- Ads have been turned on and off over the years as budgets and agencies change.
- Leads arrive from everywhere: phone, forms, Facebook messages, referrals, walk-ins.
Because everything is scattered, it’s easy to:
- Over-credit referrals when things feel busy
- Blame “bad leads” when you’re actually leaking in follow-up
- Assume “marketing isn’t working” when the real issue is one or two weak links
The solution isn’t more channels.
It’s a clearer view of the ones you already have.
That’s where the Contractor Marketing Scorecard comes in.

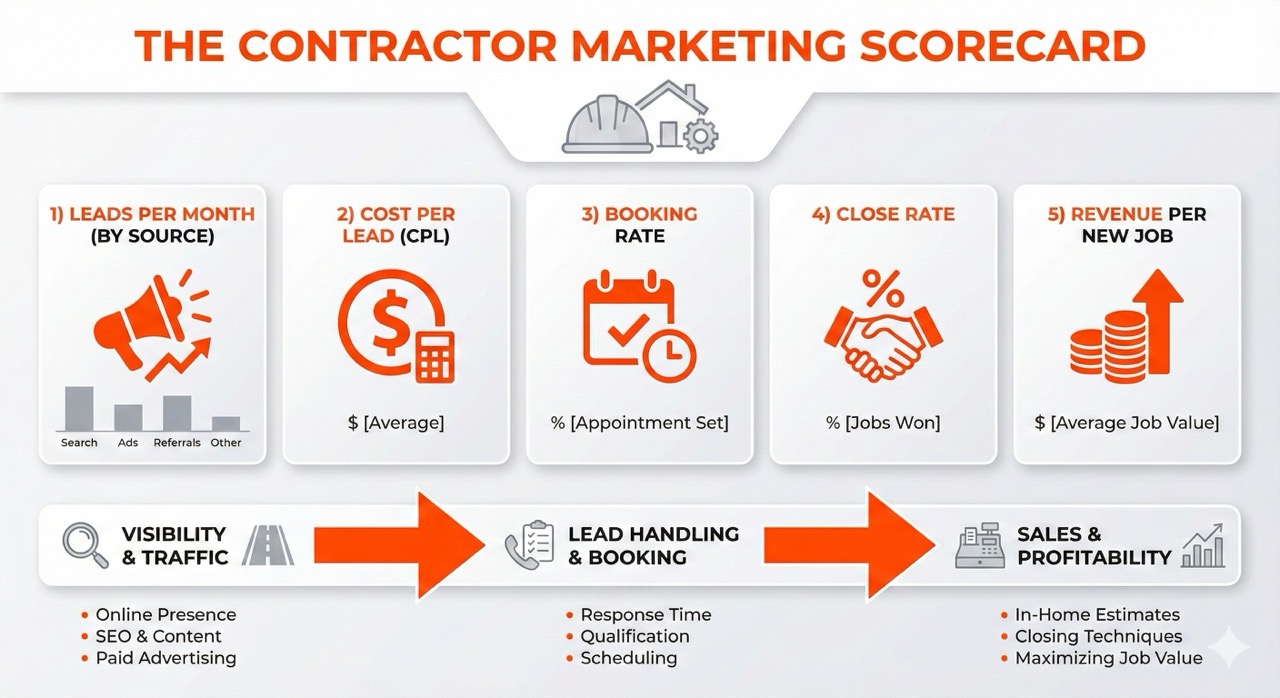
The Contractor Marketing Scorecard: 5 Numbers That Matter
You can run a serious contractor marketing operation by tracking just five numbers, consistently:
- Leads per month (by source)
- Cost per lead (CPL)
- Booking rate
- Close rate
- Revenue per new job
You can measure these whether your leads come from:
- Google Ads and LSAs
- SEO and organic search
- Meta (Facebook/Instagram)
- Local sponsorships or mailers
- Referrals
Let’s break them down.
1. Leads per month (by source)
What it is
Total number of new leads in a month, broken out by where they came from.
Think:
- Google Ads – 32 leads
- LSAs – 18 leads
- Organic/SEO – 15 leads
- Meta – 12 leads
- Referrals – 10 leads
Why it matters
If you don’t know how many leads you’re getting—and from where—you can’t tell:
- Which channels to invest more in
- Which ones are dead weight
- Whether marketing overall is trending up or down
What “good” looks like
You don’t need perfect tracking on day one. You need:
- A consistent way to record leads
- At least a basic source for each one (“Google,” “Facebook,” “Referral,” etc.)
What to do if this is weak
If you don’t know the number at all:
- Have your office staff log every call, form, and message in one place (CRM, job management software, or even a shared spreadsheet to start).
- Ask every new lead a simple “How did you find us?” and record the answer.
If the total is low but downstream numbers are healthy:
- You have a volume/visibility issue. You likely need more reach via SEO, local search, or paid campaigns—not another complete reset.
2. Cost per lead (CPL)
What it is
How much you spend in marketing to generate one new lead from a given channel.
Formula: Monthly spend from a channel ÷ leads from that channel
Example: Spend $2,000 on Google Ads, get 40 leads → CPL = $50.
Why it matters
CPL tells you whether a channel is even in the right ballpark. You don’t compare “we spent $2,000” vs “we spent $4,000.” You compare what it produced.
What “good” looks like
It depends on your trade and ticket size:
- Lower-ticket, high-volume work (service calls, minor repairs) needs a lower CPL.
- Higher-ticket work (roof replacements, remodels, system installs) can support a higher CPL because each job is worth more.
The real question is: “Does the CPL make sense relative to the profit per job?”
What to do if this is weak
- If CPL is rising but lead quality is okay:
- Tighten your targeting and messaging:
- On Google: clean up keyword lists and add negatives.
- On Meta: narrow your audience and speak to specific services + locations.
- Tighten your targeting and messaging:
- If CPL is cheap but leads are junk:
- You don’t have a CPL problem. You have a lead quality problem.
- Fix your offer and targeting. Cheap leads that never book are the most expensive of all.
3. Booking rate
This is where many contractors quietly lose the most money.
What it is
The percentage of leads that turn into booked appointments, estimates, or jobs.
Formula: Booked appointments ÷ total leads
Example: 80 leads in a month, 44 appointments booked → booking rate = 55%.
Why it matters
You can have:
- Good visibility
- Healthy CPL
…and still lose if your team:
- Misses calls
- Responds slowly to forms
- Doesn’t follow up on voicemails or messages
Every leak here makes every channel look worse than it is.
What “good” looks like
A lot of contractors live in the 40–60% range by default.
With better lead handling, some markets can push this higher by combining:
- Better processes (scripts, response standards)
- Better tools (call tracking, CRM, and AI reception to cover you when crews are in the field)
What to do if this is weak
Use call tracking to see:
- How many calls are missed
- How quickly callbacks happen
Put a simple process in place:
- Live answer whenever possible
- For missed calls: callback + short text
- For forms: quick call + confirm via text/email
Support that process with the right tools:
- Route calls into a central CRM and inbox so nothing slips.
- Use an AI-powered receptionist trained on your brand and services to pick up when your team is tied up, log the lead, and trigger follow-ups.
- Automate confirmations and reminders so appointments actually happen.
You don’t have to rip out everything and start over. A clear process backed by a CRM and AI receptionist can radically improve booking rate without adding more stress to the office.
4. Close rate
What it is
The percentage of appointments/estimates that turn into paying jobs.
Formula: Closed jobs ÷ booked appointments
Why it matters
If your close rate is weak, you’ll feel constant pressure to pump more leads into the top—even though the real fix sits with sales, estimates, and pricing.
What “good” looks like
Numbers vary across trades, ticket sizes, and how you price, but again: trend matters more than chasing a perfect benchmark.
You want to know:
- Are we closing more or fewer jobs than last quarter?
- Are specific service lines closing better or worse?
What to do if this is weak
- Look at how you present estimates:
- Are quotes being dropped via email and left to die?
- Or is someone walking the homeowner through the options and answering questions?
- Tighten your qualification:
- Are you sending crews to every request, or filtering out obvious tire-kickers?
- Review your offer structure:
- Are you giving “take it or leave it” numbers only?
- Could a “Good / Better / Best” approach raise both close rate and average ticket?
Often, small process changes here do more for profit than any tweak to your ad campaigns.
5. Revenue per new job
What it is
Average revenue from each new customer/job that comes through your marketing.
Formula: Total revenue from new jobs ÷ number of new jobs
Why it matters
This is how you decide what you can afford to spend to win a new job.
If the average new marketing-driven job is worth $1,500, your paid media math is very different than if that number is $4,000+.
What to do if this is weak
- Audit your service mix:
- Are your campaigns pushing low-margin work because “that’s what we’ve always advertised”?
- Improve your ticket value:
- Offer add-ons or related services that make sense for the homeowner.
- Offer options instead of a single line item.
- Focus your marketing on the most profitable work, not just “anything that keeps the schedule full.”
How These 5 Numbers Work Together
Each metric tells you something useful on its own, but the real value is in the pattern they create together.
Once you’re tracking:
- Leads per month (by source)
- Cost per lead (CPL)
- Booking rate
- Close rate
- Revenue per new job
…you can quickly see whether you have a visibility problem, a lead handling problem, or a pricing/profitability problem—without guessing.
You do not need a fancy setup to get this started. A simple spreadsheet, basic CRM, or reporting pulled from your existing tools is enough. If you choose to build or use a dashboard later, it’s simply a cleaner way to see the same story.
Here are some common patterns you’ll see once you start watching these numbers.
Scenario 1: “Marketing isn’t working”
- Leads per month: down
- CPL: up
- Booking rate: steady
- Close rate: steady
- Revenue per job: steady
What this usually means:
- You’re not getting in front of enough of the right people.
- Your targeting and messaging are off.
- Competitors may be out-bidding or out-positioning you.
In other words, this is an upstream visibility and relevance problem.
What to adjust:
- Your campaigns: keywords, audiences, and ad copy.
- Your offers and landing pages: are you speaking clearly to the work you actually want?
- Your local presence: Google Business Profile, reviews, local SEO.
What not to do:
- Don’t immediately blame your office staff or “bad leads” if booking and close rates are fine.
- Don’t shut everything off and hope referrals save the season. Fix the front of the system.
Scenario 2: “We’re getting leads, but they don’t turn into jobs”
- Leads per month: stable or up
- CPL: reasonable
- Booking rate: low or inconsistent
- Close rate: okay
- Revenue per job: okay
What this usually means:
You have a lead handling and intake problem, not a visibility problem.
Common issues:
- Calls going to voicemail and never getting a timely callback.
- Web forms sitting in inboxes.
- No clear ownership of “who calls people back and when.”
- Intake conversations that don’t build trust or set clear expectations.
What to adjust:
- Response standards:
- “We answer live whenever we can.”
- “We call back missed calls within X minutes.”
- “Form leads get a call plus a text the same day.”
- Scripts:
- A simple intake script so your office team knows what to say.
- Basic qualification questions so you’re not sending crews to obviously bad fits.
- Support from tools (optional but powerful):
- Call tracking and recorded calls for training.
- A central place (spreadsheet or CRM) where every lead is logged and updated.
- AI or human answering services to cover you when everyone’s in the field.
If these numbers are off, spending more on ads won’t fix the real issue. You’ll just pay more to pour water into a leaky bucket.
Scenario 3: “We’re busy, but profit isn’t keeping up”
- Leads per month: up
- CPL: fine
- Booking rate: fine
- Close rate: fine
- Revenue per job: flat or down
What this usually means:
You’re winning too much of the wrong work or not charging enough for the work you’re winning.
Possible causes:
- Your marketing is attracting a lot of low-margin jobs.
- You’re discounting heavily just to “win the job.”
- You don’t have a clear focus on the services that deliver the best margin.
What to adjust:
- Service mix:
- Emphasize and promote the jobs that are most profitable and sustainable.
- De-emphasize or tighten requirements on low-margin, high-hassle work.
- Packaging and pricing:
- Move away from one-line “take it or leave it” quotes.
- Offer clear options (good/better/best) where appropriate.
- Messaging:
- Make sure your website and ads are speaking to the customers and projects you actually want—not just “anyone who needs a contractor.”
In this scenario, the answer is rarely “more leads.” It’s better-defined work and stronger pricing discipline.
How to Put the Scorecard in Place (Without Adding Chaos)
You don’t have to rebuild your entire tech stack to start using this scorecard. The goal is clarity and consistency, not perfection.
Here’s a simple way to put it in place:
Step 1: Choose one place to log leads
Pick something your team will actually use:
- A shared spreadsheet,
- A basic CRM, or
- Your existing job management software, if it can track lead sources and stages.
For every new lead, capture:
- Date
- Name / contact info
- How they found you (Google, Facebook, referral, yard sign, etc.)
- What they wanted (service type)
- What happened (booked / not booked)
If this is all you do to start, you’ll already be ahead of most contractors.
Step 2: Add basic tracking on your main marketing channels
Over time, layer in:
- Call tracking numbers for your website and key campaigns
- Source tracking on forms (e.g., which page they came from)
- Simple tags in your system for “Google Ads,” “SEO,” “GBP,” “Referral,” etc.
This doesn’t need to be perfect from day one. The goal is to get directional data you trust enough to act on.
Step 3: Review your scorecard monthly
Once a month, pull:
- Total leads per source
- Total booked appointments
- Total closed jobs
- Total marketing/ad spend (by channel if you have it)
- Total revenue from new jobs
From that, calculate:
- Leads per month (by source)
- CPL (where you know spend)
- Booking rate
- Close rate
- Revenue per new job
Ask three questions:
- Did any of these numbers move in a big way (up or down)?
- Does that movement make sense based on what we changed last month?
- If we could only improve one of these next month, which one would have the biggest impact?
That’s your focus.
Step 4: Make one focused change per quarter
You don’t need to “fix everything” at once. Use the scorecard to pick a focus each quarter:
- Quarter 1: Improve lead volume and visibility.
- Quarter 2: Tighten lead handling and booking.
- Quarter 3: Improve close rate and estimate process.
- Quarter 4: Lift revenue per job with better service mix and pricing.
This is how you build a real marketing system over time instead of bouncing between tactics.

Where MassMonopoly Fits In
If all of this sounds like a lot to wire together while running crews and jobs, that’s exactly why we built our contractor offering in the first place.
MassMonopoly helps growing contractors:
- Design a marketing system that makes sense for your business:
- Website and landing pages built to convert
- Local SEO and Google Business Profile optimization
- Campaigns on Google and Meta where it makes sense
- Review generation and reputation management
- Put the right tracking in place so your scorecard is real, not guesswork:
- Lead source tracking
- Call tracking and recorded calls
- A simple way to log and review leads and outcomes
- Improve lead handling and follow-up:
- Guidance on intake scripts and processes
- Support for using tools (including AI-assisted reception and follow-up, if you want it) to plug gaps when you’re in the field
- Review your numbers with you, not just send reports:
- Monthly or quarterly conversations around the five scorecard metrics
- Clear recommendations on what to change next—campaigns, pages, processes—not just “more budget”
If you already have some pieces in place, we work with what you’ve got and fill the gaps. If you’re starting from almost zero, we build the foundation with the scorecard in mind from day one.
Next Step: Get Your Contractor Marketing Scorecard Built
Right now, you might have:
- A website you’re not sure is pulling its weight
- Some mix of ads, SEO, and referrals you “think” are working
- Limited visibility into what really happens after the phone rings
If you want to stop guessing, a good first move is to get your Contractor Marketing Scorecard mapped out.
If you’d like help, we can:
- Look at how you’re currently getting leads
- Identify what you can already measure today
- Sketch out a simple scorecard and tracking setup that fits your business size and team
Request Your Contractor Marketing Scorecard Review
You’ll walk away with a clear picture of the five numbers you should be watching—and a practical plan for how to start tracking them, whether you work with us or keep it in-house.